
ShotTracker Breaking Down the Real Cost of Winning in March
What Does It Cost to Win in March? NIL Spending & the 2026 Tournament
Part 3 of our series on NIL investment and the 2026 NCAA Tournament
Part 1 asked what it costs to build a tournament-caliber roster and found that seeding and spending don’t line up as neatly as you’d expect. Conference affiliation and program history drive investment more than where the selection committee eventually places a team. Part 2 looked at what conferences got back from the tournament in direct revenue, with the Big Ten winning both titles while sitting on the largest NIL footprint in the sport.For the final post in the series, we’re asking the question everyone in a front office is already running: how much NIL does it cost to win March Madness, and does the answer actually hold up when you stress-test it round by round?
The Climb
Start with the men’s side. The 68 teams that entered the tournament carried an average NIL median of $5.6M. The 32 teams that made it to the Round of 32 averaged $8.0M. From there the curve keeps rising — $8.6M in the Sweet 16, $9.3M in the Elite Eight, $9.9M in the Final Four.
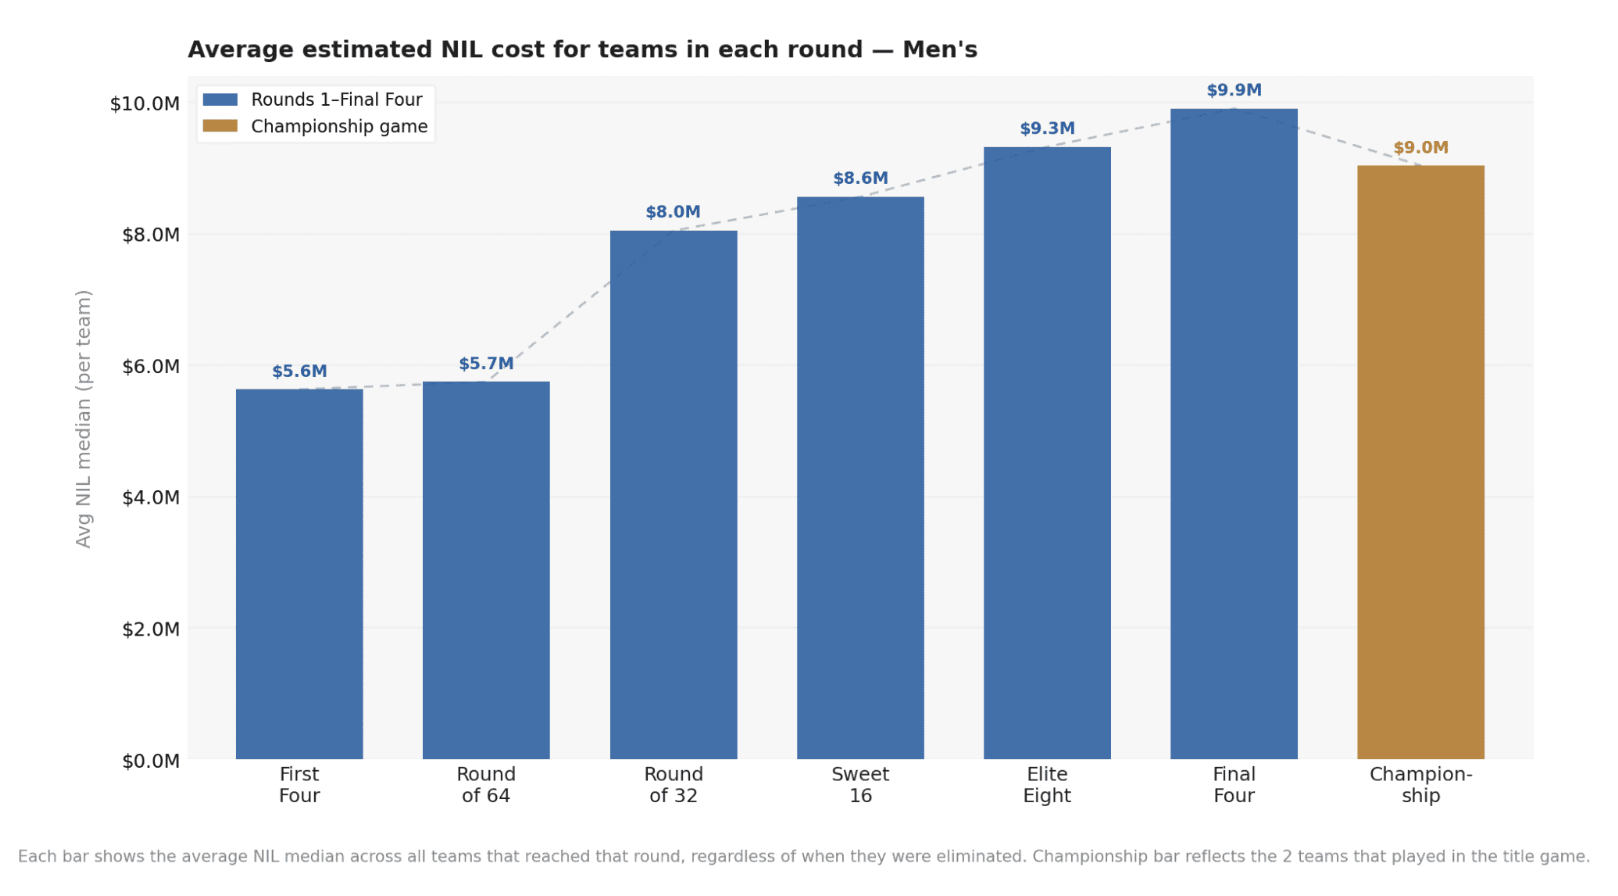
Then the two teams that played for the title averaged $9.0M, below the Final Four average and below the Elite Eight.
The women’s tournament shows a sharper version of the same pattern. The 68-team field averaged $649K. Round of 32: $927K. Sweet 16: $955K. Elite Eight: $1.11M. Final Four: $1.22M. Championship game: $1.09M.
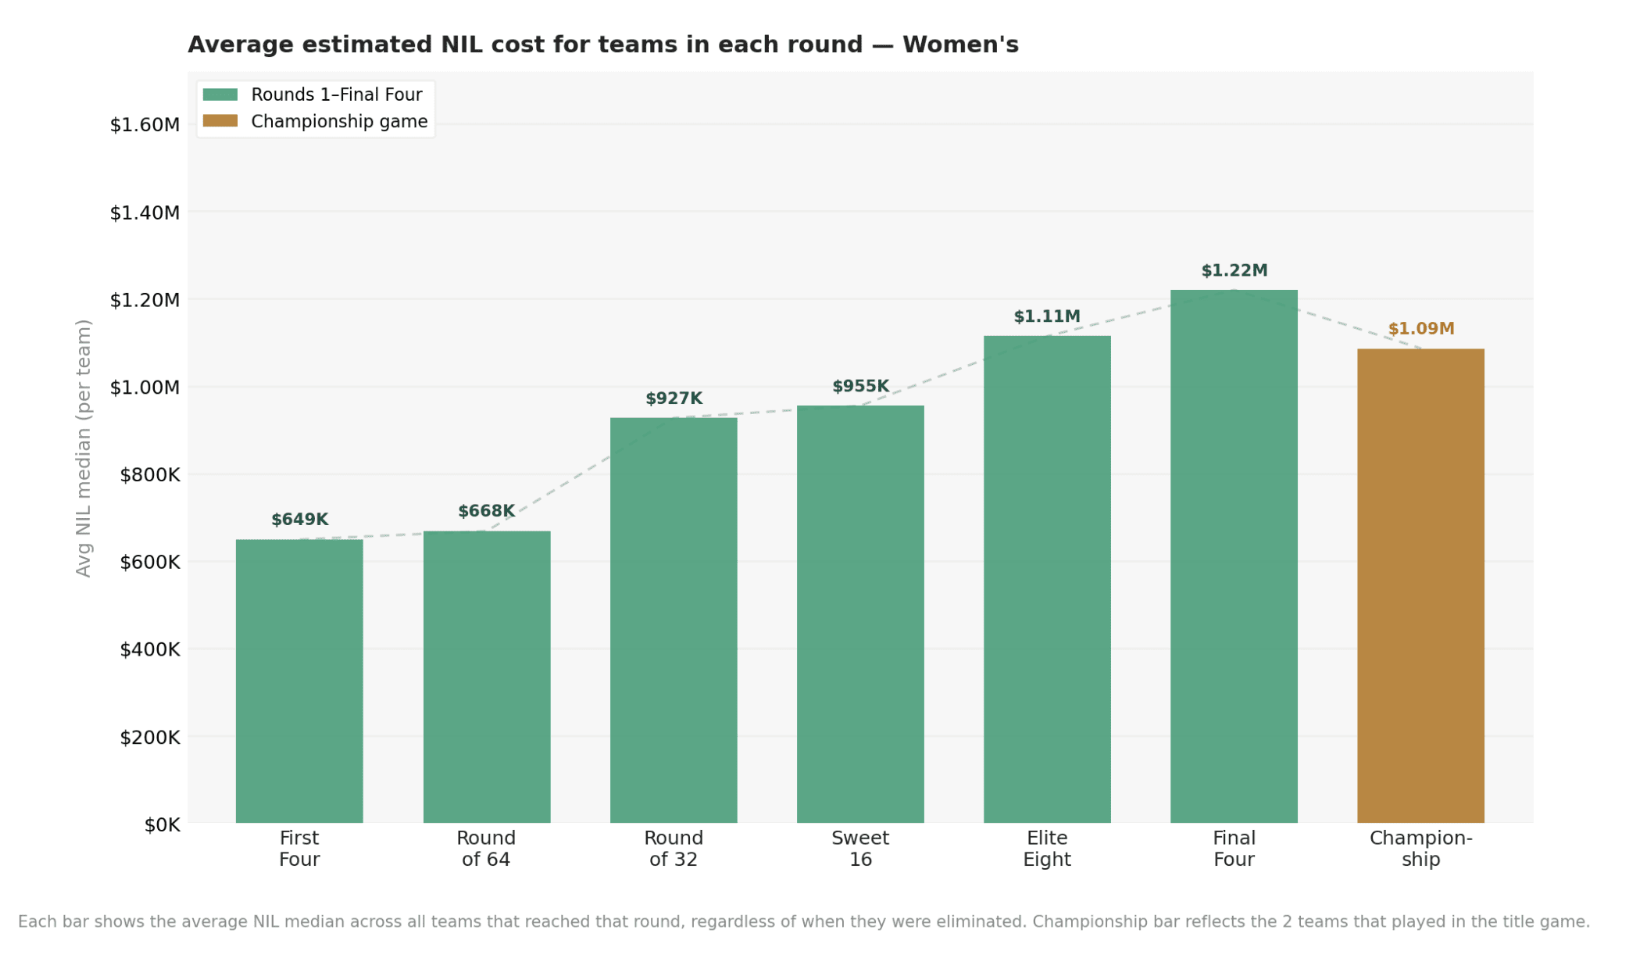
Neither champion was the highest-spending team in its Final Four, and neither title matchup averaged above its round.
The Cost of Avoiding an Upset
The biggest single-round jump on both sides of the bracket is the same one: Round of 64 to Round of 32. Men’s teams go from an average of $5.7M to $8.0M — a $2.3M gap, the largest step in the tournament. Women’s teams go from $668K to $927K, nearly 40% higher.
Some of that jump is arithmetic. Half the field goes home after the opening round, and the half that goes home skews toward the lower NIL end of the bracket. Most of the automatic qualifiers from the MEAC, SWAC, NEC, Patriot League, Southland, Ohio Valley, Big South, and America East don’t survive, and those are conferences with total NIL footprints in the low-to-mid seven figures. Their exits pull the remaining field’s average up without anyone actually changing what they spent.
A handful of Power conference teams lose in the opening round every year too, and when they do, they take high NIL figures with them. The Round of 32 average still climbs sharply anyway, which tells you something about who tends to survive the first weekend when the math is working against the low-NIL end of the bracket. Getting through Friday and Saturday consistently requires a roster built with real investment behind it.
What If the Bracket Had Gone Chalk?
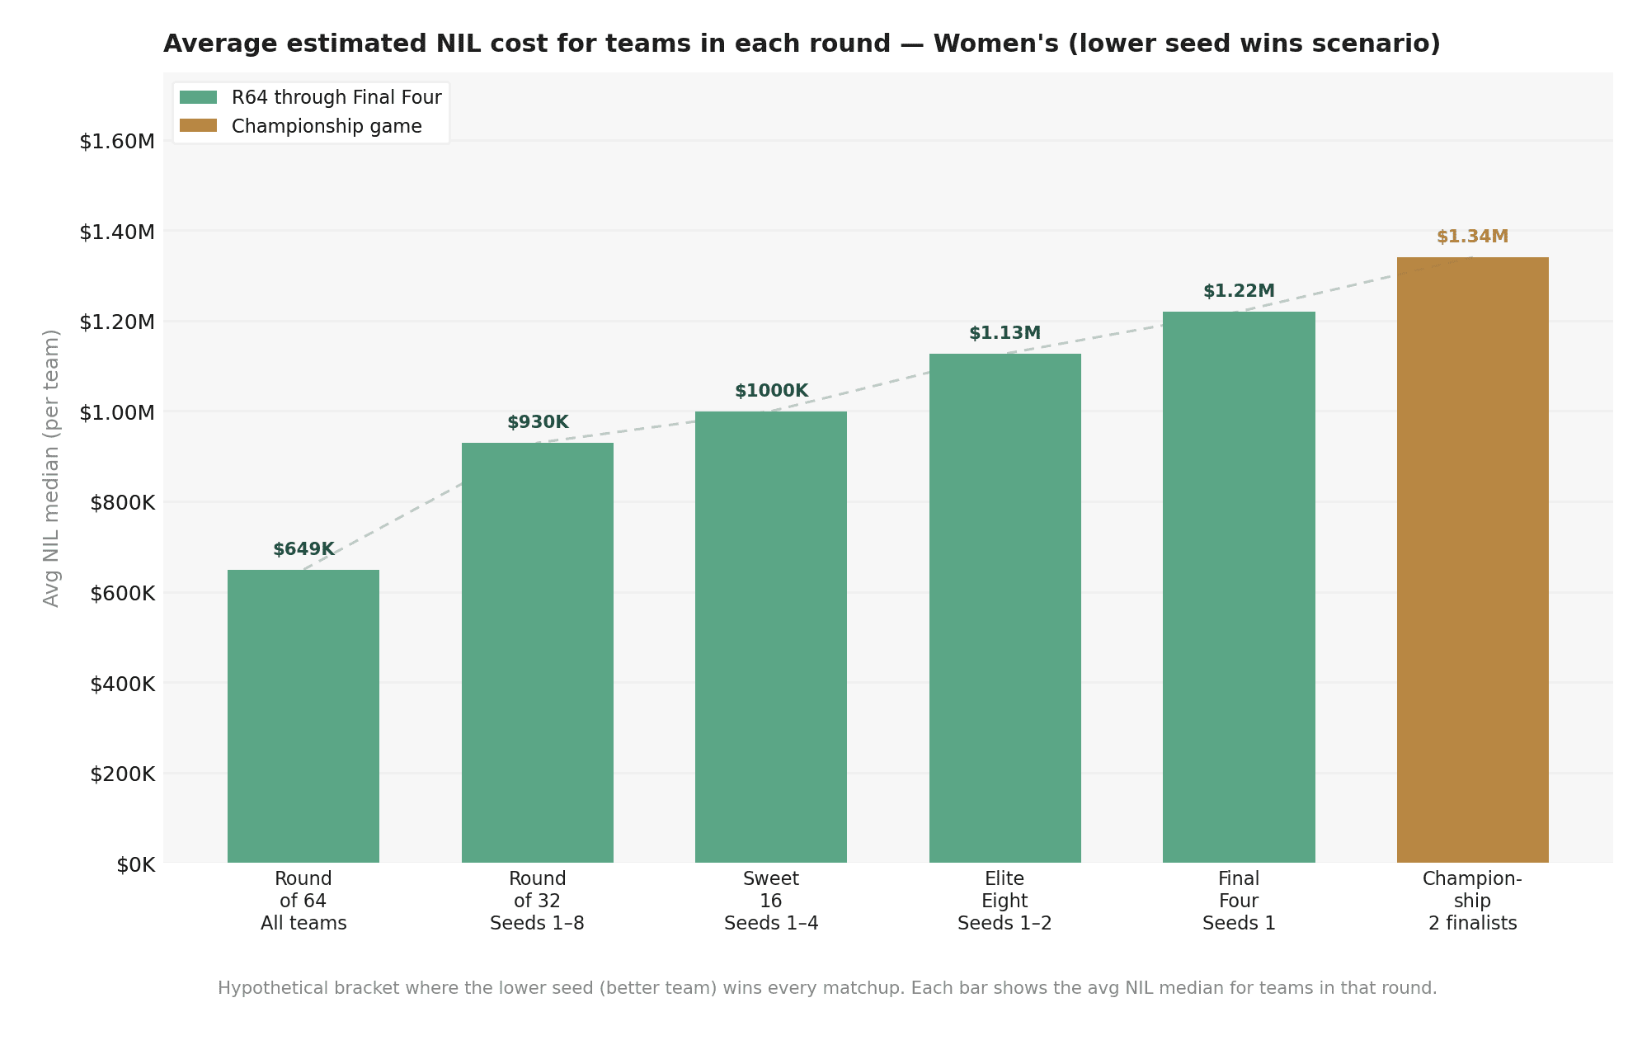
The chart below shows what the NIL averages would look like if the lower seed had won every matchup — a fully chalked bracket. In that scenario, the jump between Round of 64 and Round of 32 looks roughly similar (this year’s bracket was chalk-heavy anyway), then flattens before rising sharply at the Final Four and championship game. A chalk men’s championship averages $11.5M; a chalk women’s championship averages $1.34M. Both are notably higher than what actually happened.
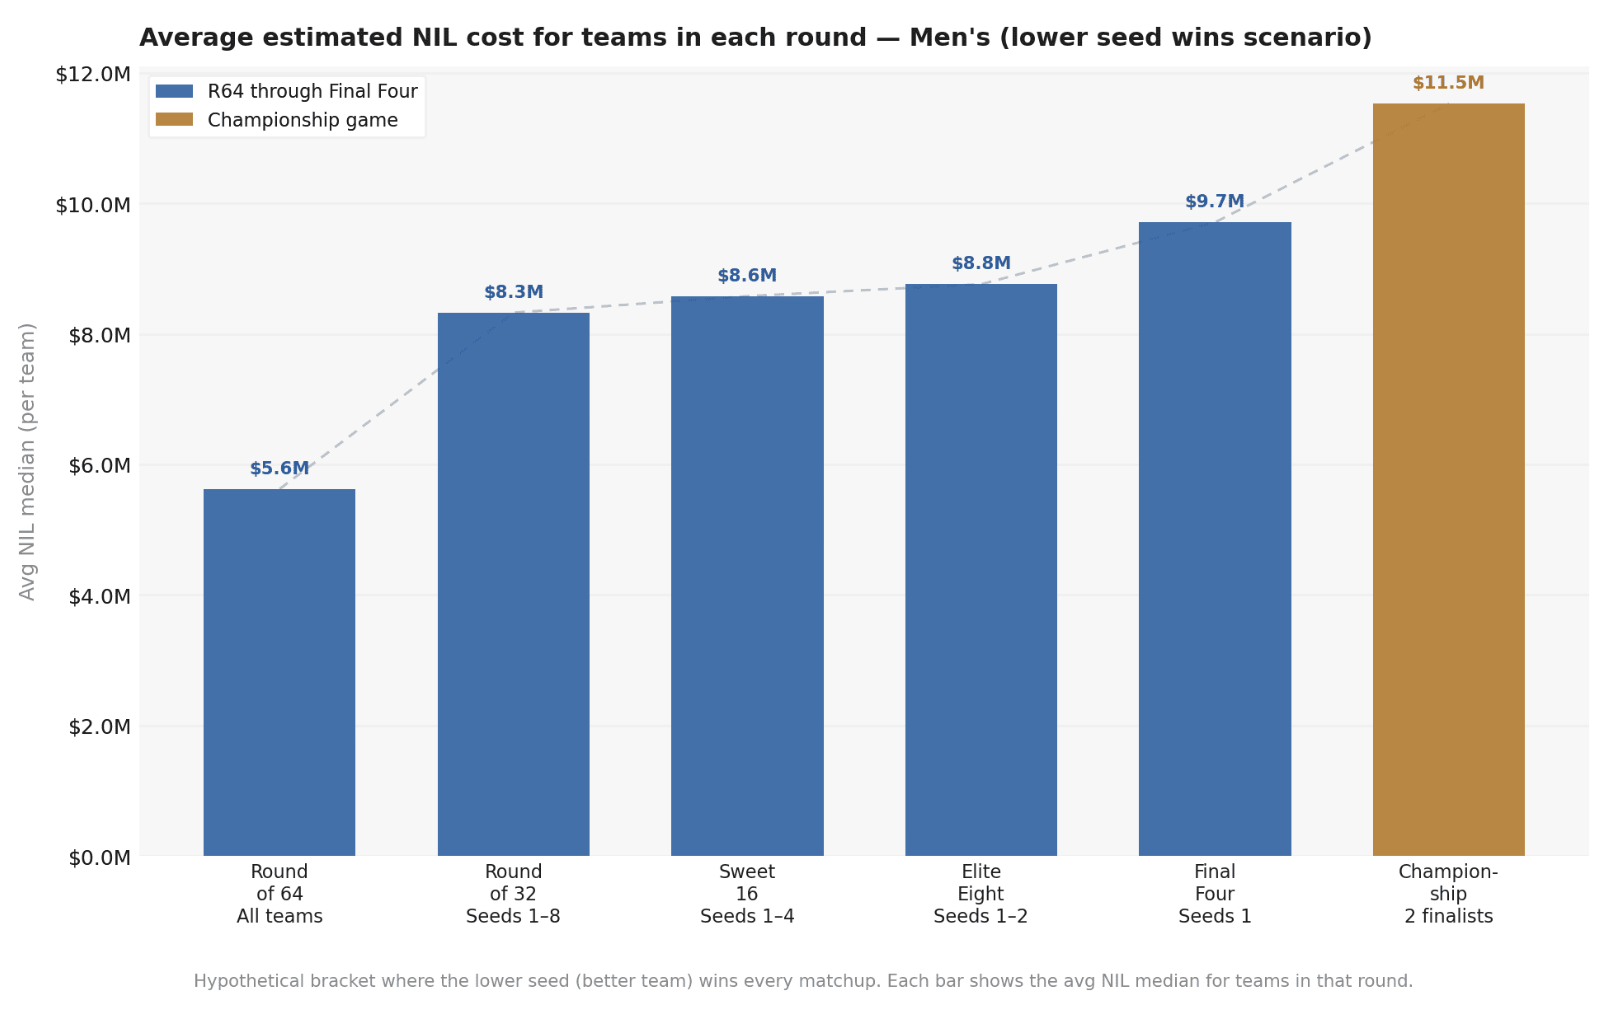
What stands out is how flat the Round of 32 through Elite Eight averages stay in the chalk version. Filtering from seeds 1–8 down to seeds 1–2 barely moves the needle on either side, which suggests NIL investment is spread fairly evenly across the top half of the bracket. The real separation only kicks in at the 1-seed line and then again at the championship game.
In reality, the title game averages came in below the Final Four averages on both sides. The gap between the chalk model and what actually happened comes down to where NIL investment sits in the bracket. Several of the highest-spending men’s programs were seeded in the middle of the bracket rather than at the top, and their early exits pulled high-budget teams out of the later averages before they could push them higher. The women’s side saw something similar: well-funded programs from conferences with broad NIL investment got seeded outside the top four lines and didn’t survive the first weekend. The chalk model assumes the best-funded teams are also the best-seeded teams. The 2026 data shows that’s not consistently true, and when it isn’t, the real averages and the theoretical ones pull apart in ways that are hard to predict before Selection Sunday.
The Bottom Line
There’s a level of NIL investment that appears necessary to compete deep into March. Teams advancing past the first weekend spent significantly more than those that didn’t. Above that threshold, the relationship between spending and winning gets weaker fast. Coaching, roster construction, matchup luck, and the general unpredictability of single-elimination basketball all play roles that no amount of NIL spending can account for.
The conference-level data from Part 2 reinforces this. The Big Ten is taking home the largest direct revenue payout of any conference in 2026, a return built on nine men’s tournament teams and twelve women’s teams running deep on both sides. That raises a question the data can’t answer yet: does that revenue get reinvested proportionally into NIL, and if it does, does it lift all members equally, or do some programs within the conference fall further behind the schools that already have the recruiting infrastructure to use it? Unit revenue flows to the conference. NIL decisions get made at the school. That gap is where the competitive dynamics of the next few years will play out.
How programs approach the NIL puzzle — concentrating spending at the top of the roster, spreading it across depth, or finding some combination that holds up in a single-elimination format — is going to matter more with each passing cycle. The unit system is two years old on the women’s side and still relatively new on the men’s. There isn’t enough data yet to say definitively what the right formula looks like. With another tournament to study, another offseason of portal movement, and another year of the market settling, 2027 should get us closer.
Source: https://shottracker.com/what-does-it-cost-to-win-in-march-nil-spending-the-2026-tournament/