ShotTracker Data Highlights Key Shooting Trends for 2026-27
Guarded vs. Unguarded: What Division I Shot Data Reveals Heading Into 2026-27
When a shot is contested, everything changes. ShotTracker tracked every Division I field goal attempt to find out exactly how much, and the results show a clear gap between what men and women do differently and why.
In basketball, not all shots are created equal. A wide open look from the corner and a heavily guarded jumper off the dribble are two completely different propositions, and treating them the same in a stat line has always been one of the biggest blind spots in traditional evaluation.
ShotTracker tracked contested and uncontested field goal attempts across Division I men’s and women’s basketball heading into the 2026-27 season. Breaking down both genders by position group, shot zone, and shot type reveals some patterns that confirm what coaches already know and others that might genuinely surprise them.
Here is what the data shows.
How Often Are Shots Guarded?

Guarded vs Unguarded frequency: Men’s and Women’s Bigs and Guards
The first thing the data makes clear is that contested shots are the norm at the Division I level, regardless of gender or position. Across both men’s and women’s basketball, guarded attempts account for roughly 78 to 81 percent of all field goal attempts. That leaves only about one in five shots coming with a clean, unguarded look.
The numbers are remarkably consistent across position groups as well. Men’s guards face guarded shots on 80.6% of their attempts, while bigs see them on 78.7%. Women’s bigs are guarded at an 81.1% rate, and guards at 78.3%. The takeaway here is simple: if a player is taking a shot in Division I basketball, the odds are strong that a defender is right there with them.
Roughly four out of every five Division I field goal attempts are taken with a defender contesting the shot. The difference is not how often shots are guarded. It is what happens when they are.
What Happens When Shots Are Guarded

The frequency numbers are similar across groups. The field goal percentages on those guarded attempts tell a very different story.
On the men’s side, bigs convert 45.2% of guarded shots compared to guards at 39.3%. When those same players get unguarded looks, the numbers jump to 67.0% for bigs and 55.0% for guards. On the women’s side the pattern is the same: bigs shoot 42.2% on guarded attempts and 58.8% on unguarded looks, while guards convert 35.7% when guarded and 49.6% when unguarded.
Two things stand out immediately. First, the gap between guarded and unguarded attempts is enormous. An unguarded shot is worth dramatically more than a guarded one at every level and position. Second, men’s players are converting at meaningfully higher rates than women’s players in both categories, particularly on unguarded attempts where the advantage is most pronounced.
Where the Shots Come From
The FG% gap between bigs and guards makes more sense once you look at where each group is actually shooting from.
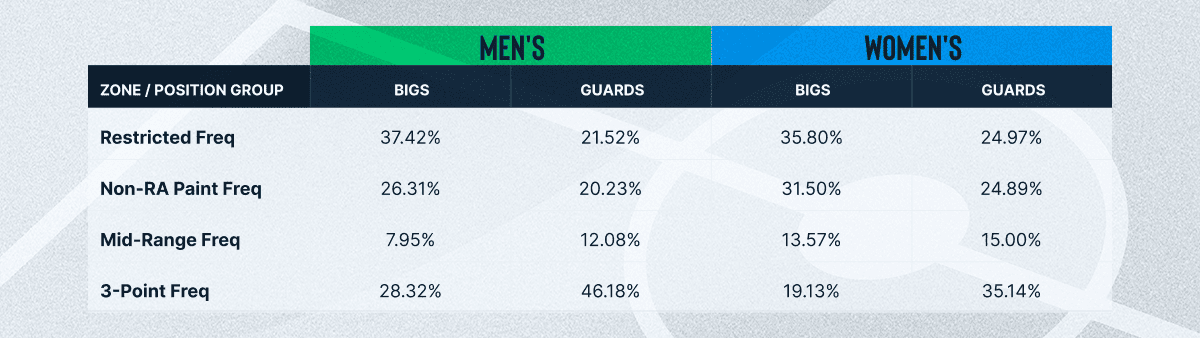
Men’s and Women’s Bigs and Guards (Restricted Area, Non-RA Paint, Midrange, 3-Point)
More than 37% of men’s big attempts come from the restricted area, the highest percentage zone for any group in the data. Women’s bigs are similar at 35.8%. Guards, by contrast, shoot only 21.5% of their attempts from the restricted area on the men’s side and almost 25% on the women’s side. Men’s guards are generating 58% of their shots from outside the paint compared to 36% for bigs. Women’s guards take 50% of their attempts from outside the paint versus 33% for bigs.
The further you get from the basket, the harder those shots become when a defender is contesting them. That shot location difference is the primary driver of the FG% gap between position groups.
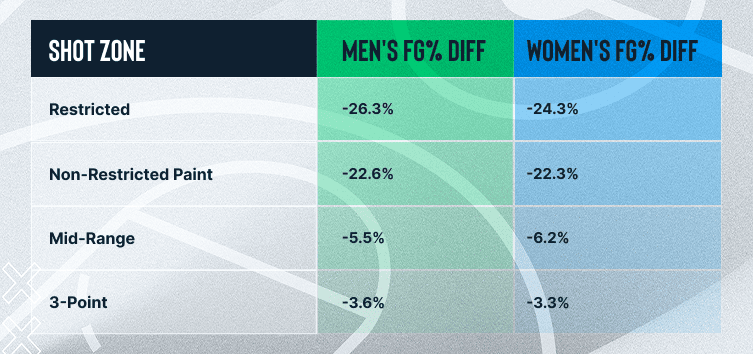
The zone charts make one pattern unmistakable: the drop in field goal percentage on guarded shots is significant across every area of the floor. On both the men’s and women’s sides, guarded attempts convert at a sharply lower rate than unguarded ones across all four shot zones, whether from the restricted area, the non-restricted paint, the midrange, or the three-point line. These drops are remarkably consistent between genders when you compare the same zones side by side.
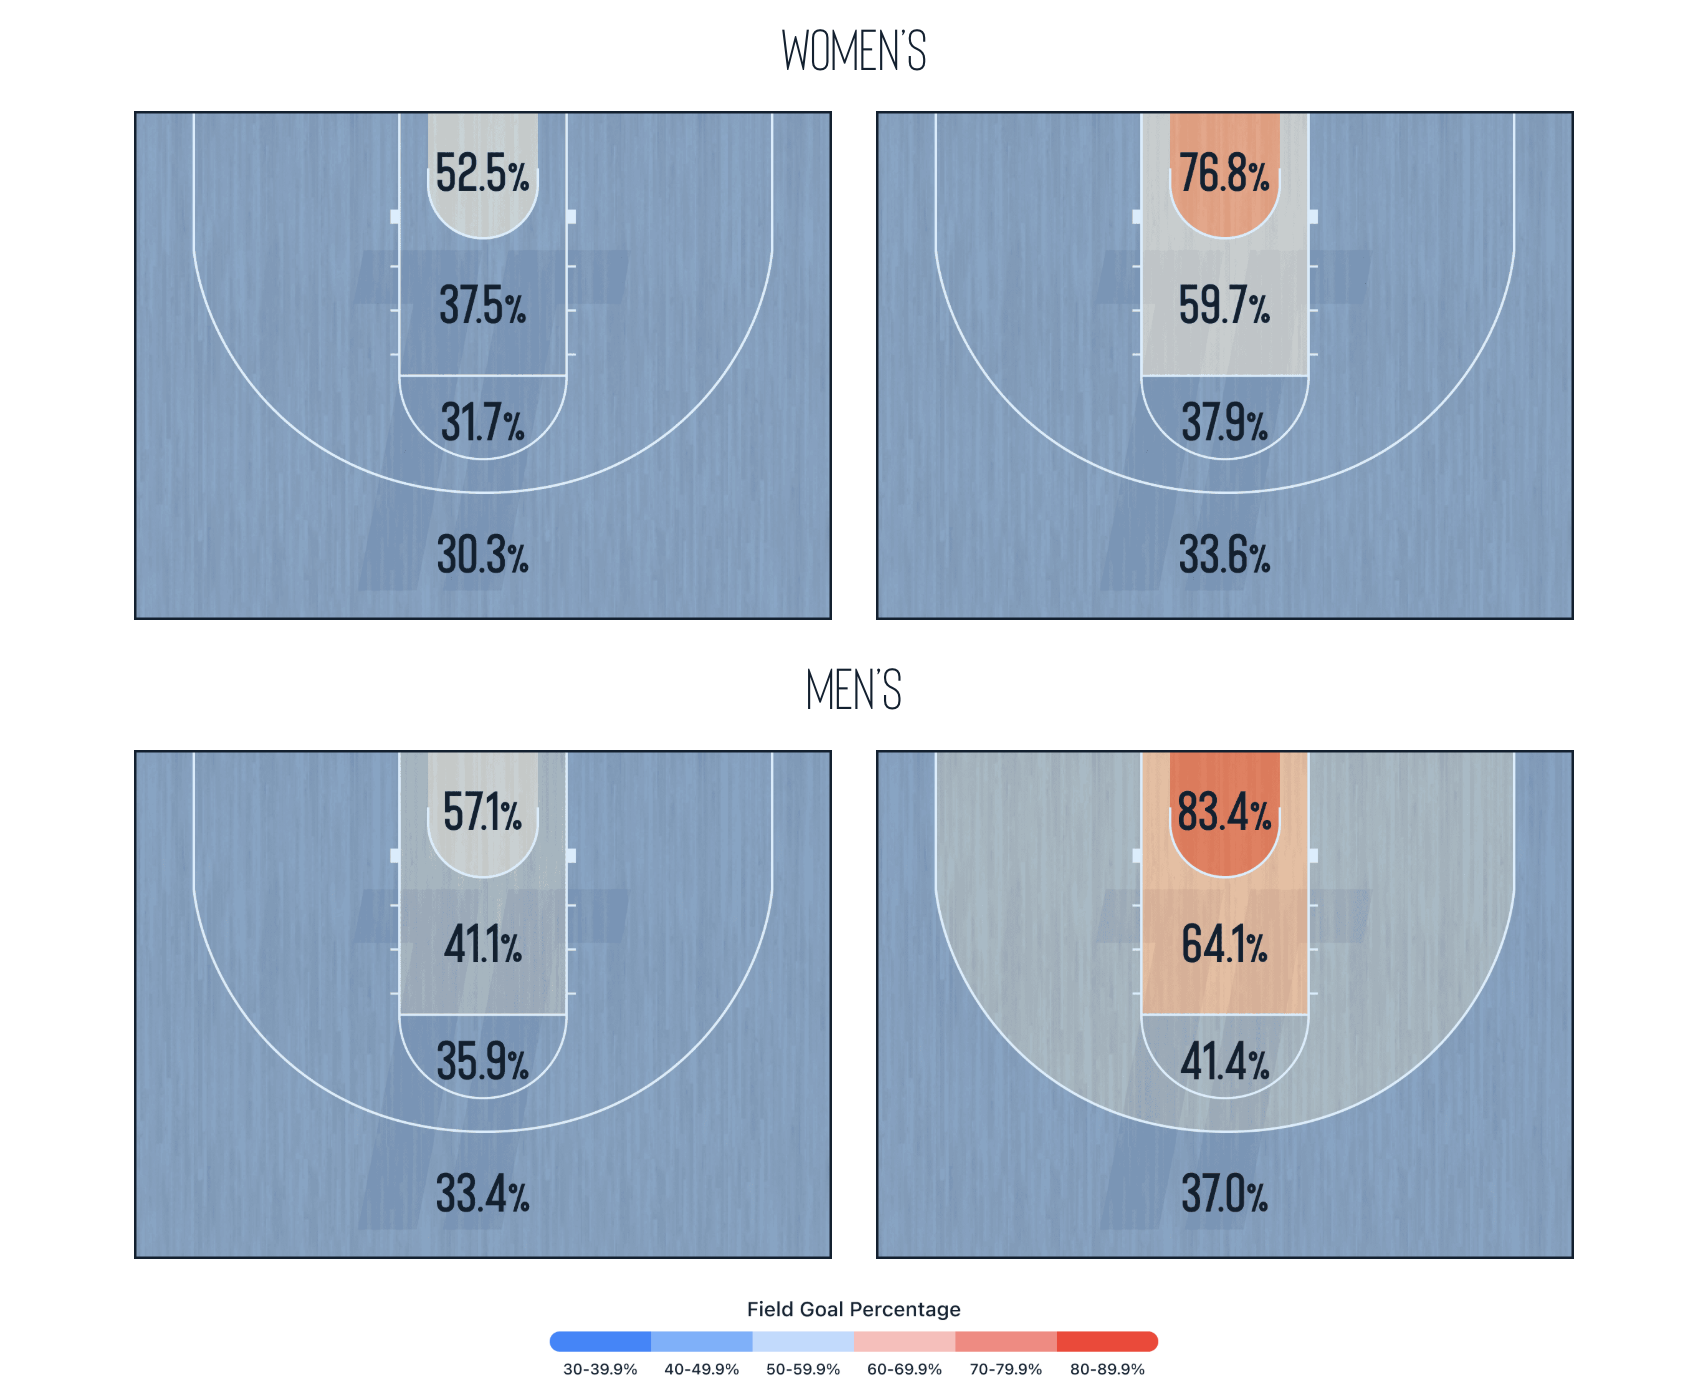
What this reveals is that men are not necessarily facing easier defensive coverage. They are simply taking a higher proportion of attempts from areas where even a guarded shot is more likely to convert. The concentrated volume near the rim, combined with the physical advantages that dunks, tip-ins, and alley-oops provide, means men’s players are working with a higher baseline of expected value on their guarded attempts. The gap in finishing rates between men and women, especially close to the basket, reflects both where the shots are being taken and the structural advantage that extra height and athleticism provides in those zones.
Why Men’s Players Convert at Higher Rates
The final layer of the data is shot type, and it is where the biggest difference between men’s and women’s basketball comes into focus.
Dunks and alley-oops account for 8.4% of all men’s attempts. Tip-ins add another 7.1%. That means more than 15% of men’s shot attempts come from two of the most easily convertible shot types in basketball, even when guarded. On the women’s side, dunks and alley-oops account for just 0.1% of attempts, and tip-ins make up 3.4%. Combined, that is only 3.5%.
The gap is even more apparent when you look at layups. Women’s players attempt layups at a 52.7% rate, compared to 37.1% for men. While layups are high-percentage shots, they are more vulnerable to defensive pressure and shot-blocking than dunks, alley-oops, or tip-ins. When women are contested near the basket, they are more likely to be attempting a layup that a defender can legitimately challenge.
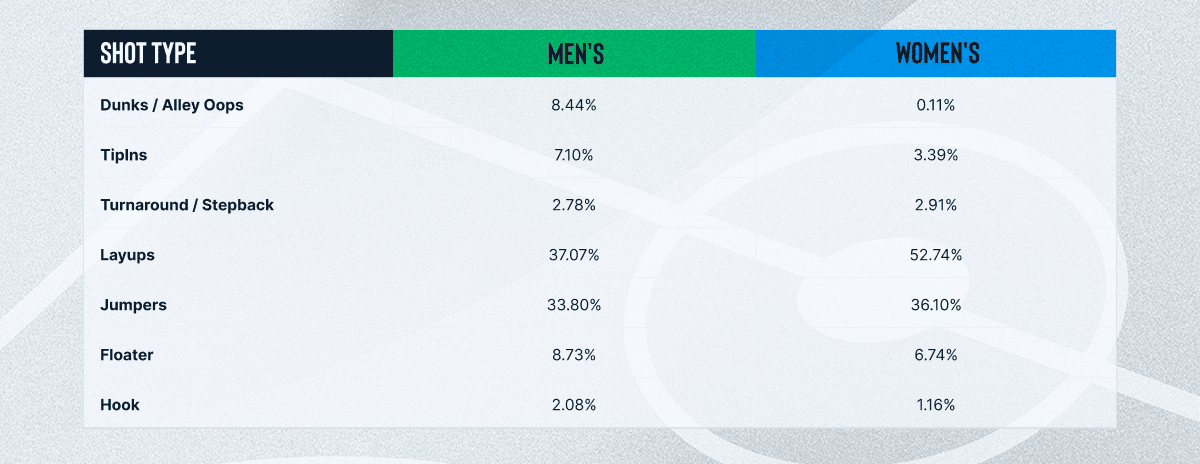
Shot type breakdown: Men’s vs Women’s (Dunks/Alley-Oops, Tip-ins, Layups, Jumpers, Floaters, Hooks)
Jumpers are consistent between the two groups, representing 33.8% of men’s attempts and 36.1% of women’s. Floaters, hooks, and step-backs account for similar small percentages on both sides as well. The meaningful divergence is concentrated in the shots that happen close to the rim, where physical profile and athleticism create the largest advantage.
What This Means
The data from Division I basketball heading into 2026-27 tells a clear story. Guarded shots are unavoidable at this level. When they happen, field goal percentage drops significantly for every group. And the reason men’s players convert at higher rates, particularly near the basket, comes down to the types of shots they are taking in those locations.
For coaches, the implication is straightforward. Creating unguarded looks is worth far more than creating any other kind of opportunity, regardless of position or gender. The gap between a guarded and unguarded attempt is not marginal. It is decisive. Every ball screen, every cut, every spacing decision a program makes is ultimately about moving attempts from the guarded column into the unguarded one.
That is what great offensive systems are designed to do. And the data makes clear that the teams doing it most consistently are the ones manufacturing the most efficient offense in Division I basketball.
All data sourced from ShotTracker. Want to see how your program’s guarded and unguarded shot splits compare to Division I averages? Request a demo at shottracker.com/request-a-demo.